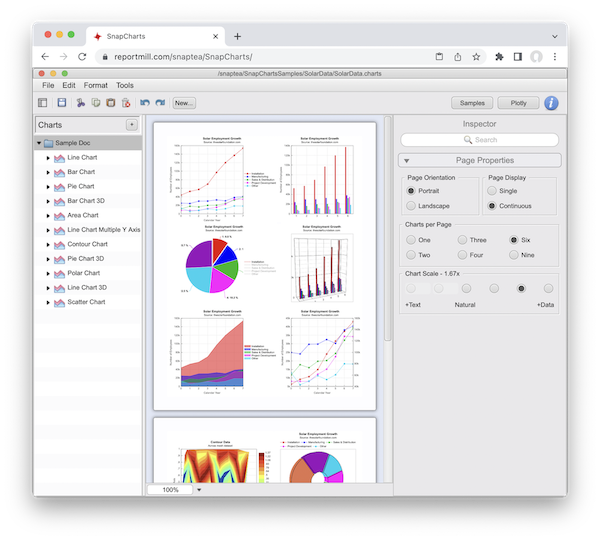
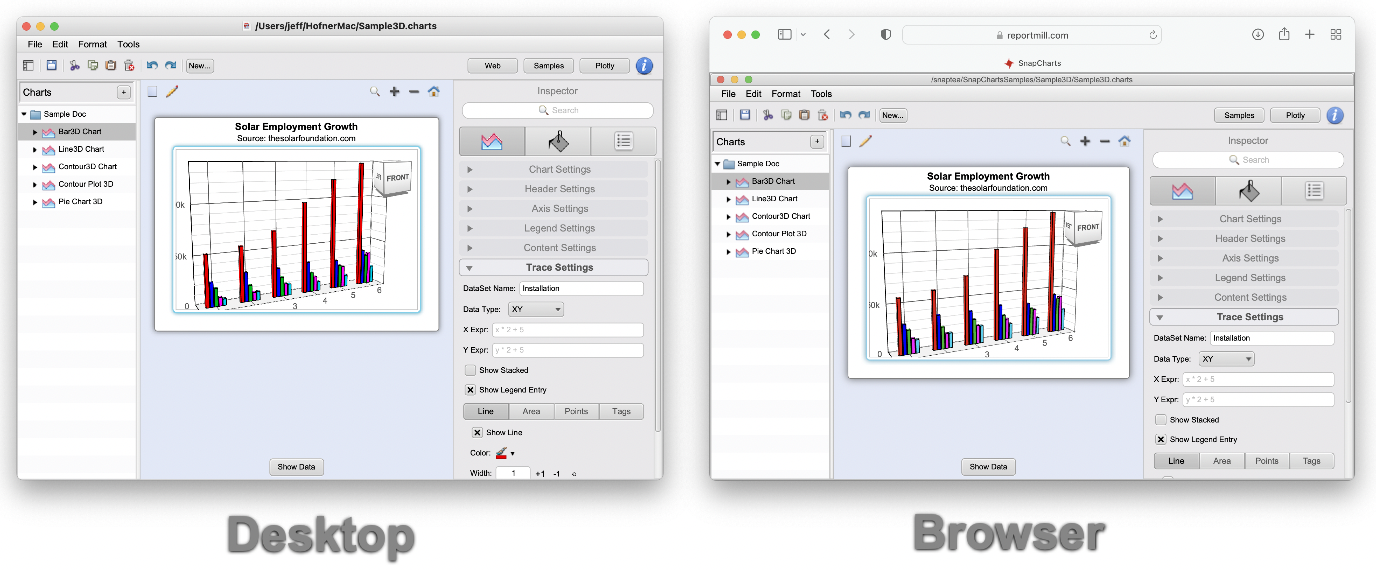
SnapCharts is an advanced business / scientific charting package for Java / JavaScript used to create / edit / view charts in the browser / desktop / server.
SnapCharts is available as a simple Jar file and a simple JavaScript file. To use in the browser, simply include the script in an HTML page. To use on the desktop or on the server, simply include the jar. SnapCharts is also available as a Maven/Gradle package.
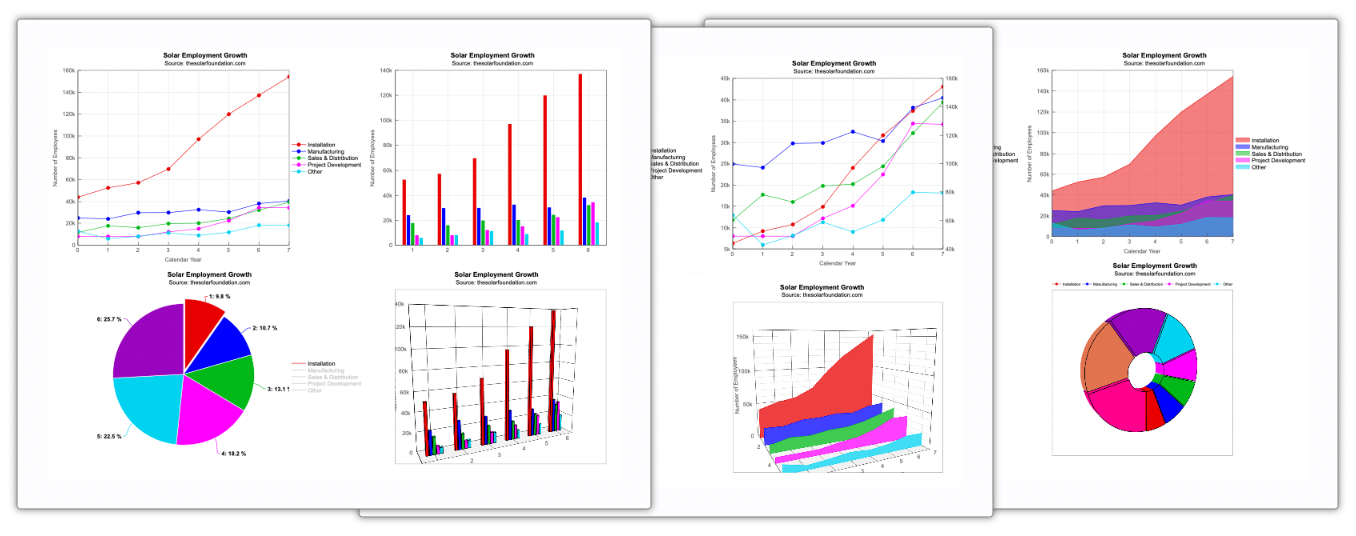
SnapCharts supports a full set of business chart types and features:
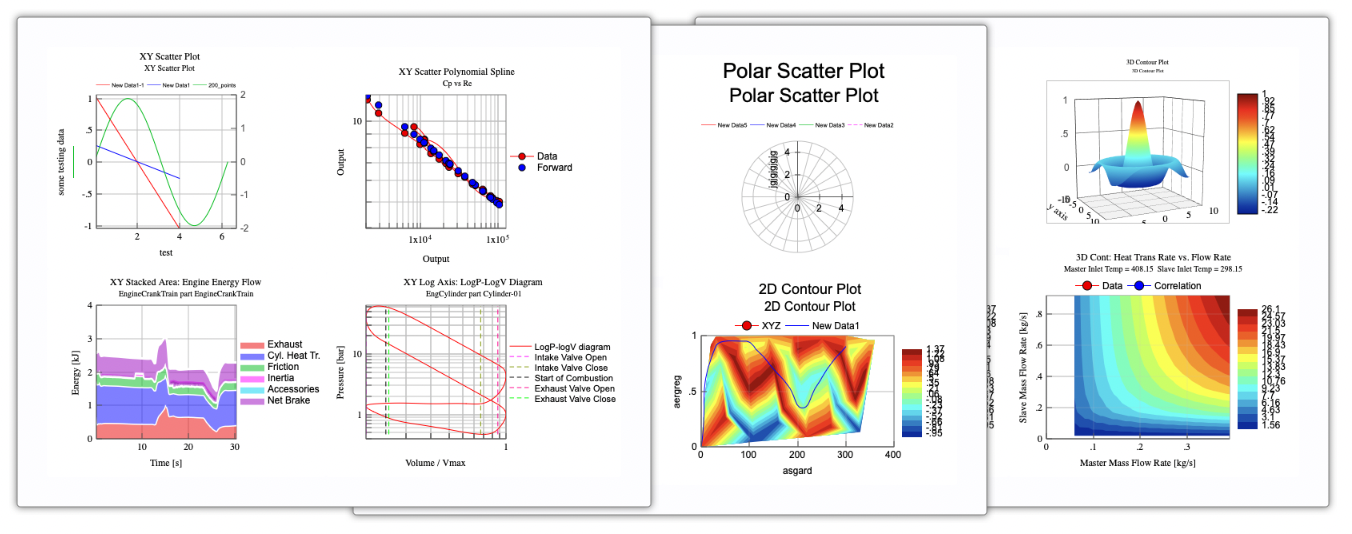
SnapCharts supports a full set of scientific chart types and features:
SnapCharts also contains a notebook processor for performing data science work such as loading, generating or modifying datasets and charts from Java code and math expressions in an interactive manner. Try this:
// Generate XYZ data
x = doubleArray(1, 2, 3, 4)            // Simple double array
y = x.map(d -> d * d)               // Y = X ^ 2
z = mapXY(x, y, (x,y) -> x + y)        // Z = X + Y
// Generate / display DataSet from XYZ arrays
dataSet = dataSet(x, y, z)// Generate / display charts
chart(x, y, z)
chart3D(x, y, z)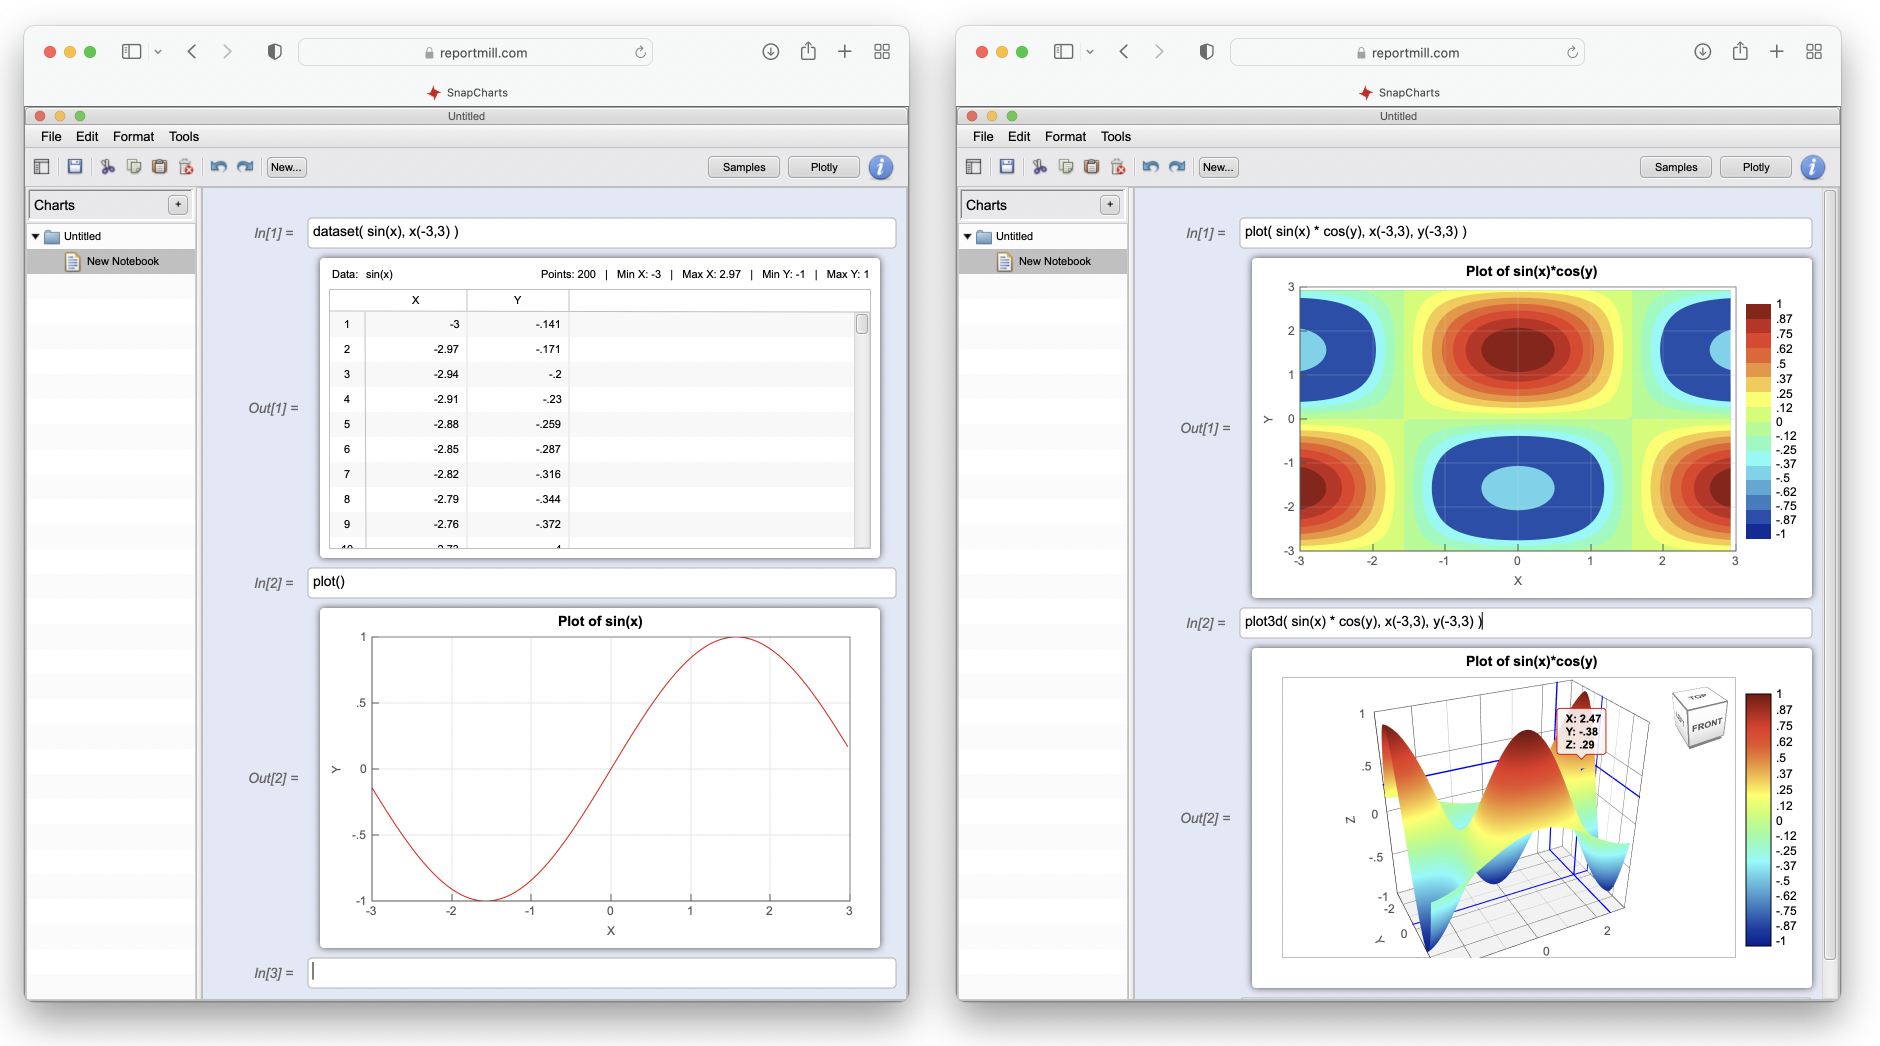
SnapCharts has a full set of page layout, presentation, reporting, markup and styling features:
SnapCharts has a full set of interactive charting features: